Survey Metrics
Surveys can be an incredibly useful way to gather data about your customer base. They provide both qualitative and quantitative data about the performance of the topic of your survey and can provide abundant opportunities to follow up conversations, especially when the surveys are specific to the actions the customer has taken in your app, and are correctly targeted. Let’s talk a little bit more about the different types of surveys that you can implement, and what they can tell you.
CSAT
We’ve already talked a little bit about customer satisfaction (CSAT) surveys, but they are valuable enough that they deserve to be reiterated. CSAT surveys are usually short surveys that ask about how a customer felt about a specific interaction that they had with one of your customer-facing teams. Some companies choose to send them directly after the interaction while others choose to include a variation of them in the signature of employees like you can see here in this example from Shopify:
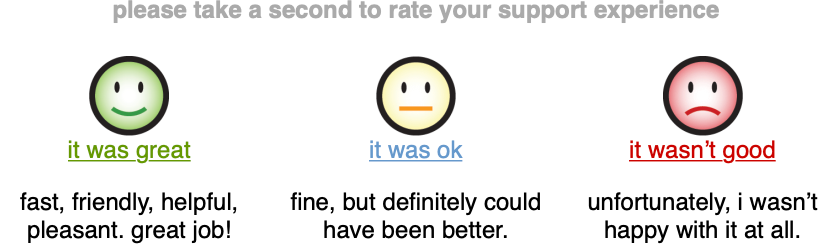
No matter how you send it, the gist is that you give the customer something along the lines of “How would you rate your interaction?” and give them the opportunity to pick between “Awesome,” “Okay,” or “Bad” and then allow them to offer you some more qualitative feedback in the form of a typed out response. As a benchmark, it’s generally best to keep negative or passive comments to around 10%. There are some great questions that you can ask yourself if you’re hoping to get a bit of a deeper understanding of your CSAT and how it’s driven by your customers:
- Are my detractors and passives happening because of issues with my support team, or because of issues with my product?
- What strategy should I take for responding to people who rate me passively or as a detractor?
- How should I send my CSAT survey, if at all?
- How is our response rate to our CSAT survey, and could we make it better?
There are often a lot of CSAT responses that come from customers being dissatisfied with your product or wanting something that you don’t currently do. Another common problem with CSAT is that the same customer can respond multiple times to one conversation if you have the option to do so in the signature of your email response. This can dilute the metric, and make your rating seem far lower than it is. Take these to heart as you move forward with interpreting and sharing information from this specific metric.
Customer Effort Score (CES)
While there are many ways to rank and measure customer happiness and satisfaction (like CSAT above), customer effort score is one of the best. Our friends at Hubspot put it well: customer effort score (CES) is a type of customer satisfaction metric that measures the ease of an experience with a company by asking customers. By using a five-point scale of “Very Difficult” to “Very Easy,” it measures how much effort was required to use the product or service to evaluate how likely they are to continue using and paying for it. Basically, how hard did the customer have to work to get to what they needed?
CES is usually used
in place of
CSAT or alternating with CSAT — you don’t want to overwhelm your customers with questions,
after all. If you send too much, they are significantly less likely to respond — think about
it from your perspective, if you get asked something repeatedly it starts to get frustrating
and annoying, and eventually you just don’t hear it anymore. This happens with CSAT, too.
If you’re experiencing high effort scores, there are a few things that you can ask yourself
and your team:
- Could we make our self-service documentation easier to use to lower the effort score?
- What are the things that people are expressing qualitatively on their surveys?
- Does our customer service team need to do more proactive outreach to lower our effort score?
- How does when we send the CES survey affect how the ratings for CES go? You can send it: right after an interaction or purchase, right after an interaction with your customer support or service team, or to measure an overall experience with a product or service.
There are no “catch-all” metrics, but CES is certainly one of the ones that can tell you about multiple parts of your company. If your product is difficult to use or unsatisfactory, it will take a dip into CES. If your support team or support process is subpar or doesn’t get to answers easily enough, your CES will plummet. Targeting — so you know where your specific CES scores are coming from — can give excellent insights into where you can make improvements and get better.
Net Promoter Score (NPS)
NPS is the talk of the town across most departments at most companies, and that’s because
it’s the metric that measures how customers
feel
about your company, and how likely they are to talk about it to their friends and family. NPS
Surveys are traditionally populated via email or a pop-up on your website, and ask customers
a variation of “How likely are you to recommend this company to your friends or colleagues?”
with a scale of one to ten accompanying it (one being least likely to recommend, ten being
most). Sometimes, surveys also give the option to include a qualitative message after the
survey is completed, or underneath the ranking options.
Satmetrix
defines each of the groups, based on their NPS scores as:
- Promoters (score 9-10) are loyal enthusiasts who will keep buying and refer others, fueling growth.
- Passives (score 7-8) are satisfied but unenthusiastic customers who are vulnerable to competitive offerings.
- Detractors (score 0-6) are unhappy customers who can damage your brand and impede growth through negative word-of-mouth.
The calculation of your Net Promoter Score is % promoters − % detractors = NPS, and the
average score, according to Satmetrix, is around five. Some questions to consider if you have
a low NPS score are:
- How are we currently serving areas like feature requests or customer education?
- Which groups of customers are least and most satisfied with our product, and what differentiates them?
- What is the best way to reach out to people who are detractors or passives? Is there a best-practice strategy?
While these can’t make an immediate impact on your score, they can create a better experience for your customers and turn someone who was a detractor into a promoter. After all, imagine if you had an awful experience at a retail store, left constructive insights in an email that was sent to you prompting you for feedback and received a call from the manager directly addressing your concerns and looking to make amends. While you were frustrated initially, that probably quickly passed as the manager heard you out, and helped to make things right personally. That’s the same thing that you can do for your customers.
How much would you miss us?
Some customers may be familiar with NPS and find it robotic. Or, maybe it doesn’t fit your brand tone. As an alternative, and to detect slightly different sentiments, sending out a “how much would you miss us?” instead of “would you recommend us?” can be just the shift in language to get better engagement with your surveys. The sentiment of “missing” implies a much deeper emotional bond and attachment to your brand, though, than recommending. After all, you miss your mother’s home cooking but would recommend your local pizza joint to a friend. If you use this question with an audience that is not receptive to it, you may find yourself with a lower score than you anticipated.
Here are a few questions that you can ask if you find your score lower than you would like:
- What can we do to emotionally engage with our customers?
- How can we make our product stickier and have customers use it in their day-to-day?
- Are our customers a demographic of people who want to emotionally engage with products that they use?
- Is our product the type of product that people traditionally emotionally engage with?
It’s very possible that, rather than switching out NPS in favor of something slightly more emotionally charged, you should target your NPS differently to gain better insights. While NPS can be tedious and frustrate some users, use that qualitative, constructive feedback to create a better process for sending out your survey and you may be better off.
Response rate
While this isn’t a survey that you send out, it’s an important metric to consider as you do. Many people want their response rate to be higher — they think that a higher response rate means better data, but this is not necessarily true. According to Goodhart’s Law, “when a measure becomes a target it ceases to become a good measure.” So, when you start making your metrics into something that you are aiming for, for example, a specific percentage of response rate, it ceases to be a valuable metric.
The reason behind this is because, as you attempt to boost it often the incentivization will create artificially positive ratings. If you give someone a reward or a treat in exchange for filling out your survey to boost your response rate metric, the ratings will primarily be positive and probably not terribly useful. It is better to have a lower response rate to your surveys but have the responses be honest than to incentivize responding with a gift card or reward only to receive more responses, but with less incisive insights.